
Your laptop fan is screaming and nothing looks busy. A build that used to take two minutes now takes ten. The desktop stutters every time you open a fourth browser tab. Something is eating your resources, and guessing rarely finds it.
A system monitor finds it in seconds. It shows what your CPU, memory, disks, and network are doing right now, and which process is responsible. Linux ships with a few decent monitors, and you can install better ones in under a minute.
This guide explains what system monitors do, which built-in options are worth using, and which tools deserve a place on your machine. Every pick includes pros, cons, and the command to install it.
In This Guide
- Comparison table
- What a system monitor does
- Built-in system monitors
- Best system monitors to install
- Specialist tools worth knowing
- How to read the numbers
- How to choose
- Keeping web dashboards safe
- FAQ
Quick Picks
- Best overall terminal monitor: btop
- Best lightweight classic: htop
- Best for remote access and data export: Glances
- Best for server dashboards and alerts: Netdata
- Best desktop app: Mission Center
- Best for finding out what happened last night: atop
Linux System Monitors Compared
| Tool | Interface | Best For | Typical Overhead | Remote Use |
|---|---|---|---|---|
| top | Terminal | Emergencies on any machine | Very light | Yes, over SSH |
| htop | Terminal | Daily process management | Very light | Yes, over SSH |
| btop | Terminal | All-in-one overview | Light | Yes, over SSH |
| Glances | Terminal and web | Remote access and data export | Light to moderate | Yes, web and API |
| Netdata | Web | Server dashboards and alerts | Moderate | Yes, web |
| Mission Center | Desktop app | Task Manager style overview | Light to moderate | No |
| Resources | Desktop app | Simple GNOME-style replacement | Light | No |
| bottom | Terminal | Custom layouts | Light | Yes, over SSH |
| atop | Terminal | Historical analysis | Light, plus log writes | Yes, over SSH |
| nmon | Terminal | Tuning and benchmarks | Very light | Yes, over SSH |
| Conky | Desktop widgets | Always-on display | Very light | No |
What Does a System Monitor Do?
A system monitor reads live statistics from the kernel and displays them in a form you can act on. Most of that data comes from the /proc and /sys virtual filesystems, which the kernel updates constantly. The monitor polls those files every second or two and draws the results as numbers, bars, or graphs.
A typical monitor tracks:
- CPU: usage per core, load average, and often clock speed.
- Memory: used, cached, and available RAM, plus swap.
- Processes: every running program with its PID, owner, CPU share, and memory use.
- Disks: free space and read and write activity.
- Network: upload and download speed per interface.
- Sensors: temperatures, fan speeds, and battery status, on tools that support them.
- GPU: usage, VRAM, and temperature, also tool-dependent.
Why You Would Want One
- Find the culprit fast. One process pinning a core at 100% is obvious in a monitor and invisible without one.
- Work out what kind of slow you have. CPU, memory, disk, and network problems feel identical from the keyboard. A monitor tells them apart.
- Catch memory leaks early. Watching a process grow by a few hundred megabytes an hour beats learning about it when the OOM killer takes out your database.
- Spot swap thrashing. A system that keeps moving data between RAM and disk crawls, and a monitor shows it happening.
- Watch temperatures. A laptop that throttles under load usually has a cooling or dust problem you can confirm with a sensor readout.
- Notice things that do not belong. An unknown process using all your CPU at idle deserves a closer look. Cryptominers on compromised servers often show up exactly this way.
- Measure changes. Before and after numbers show whether a config tweak, kernel update, or new driver helped.
Built-In System Monitors on Linux
You do not need to install anything to start. Every distribution ships with at least one monitor, and which one you get depends on your desktop environment.
top
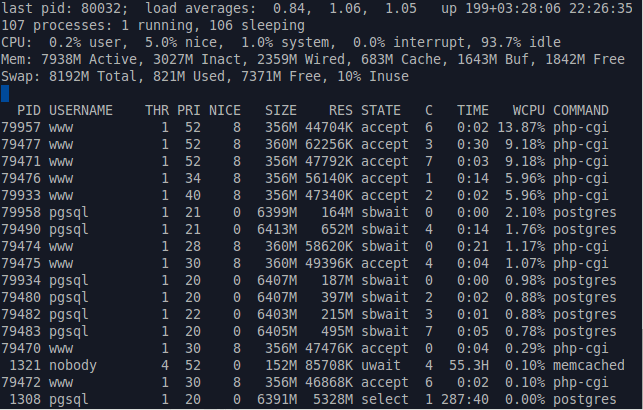
The original. top is part of the procps-ng package and sits on practically every Linux system, including minimal servers and containers. Run top, press P to sort by CPU, M to sort by memory, 1 to show each core, and q to quit.
Pros
- Installed almost everywhere.
- Tiny footprint, works over any SSH connection.
- Nothing to install when a server is misbehaving.
Cons
- Plain interface with no graphs.
- Single-key commands are hard to discover.
- Shows little about disk and network activity.
Best for: quick checks on bare servers and rescue situations.
GNOME System Monitor
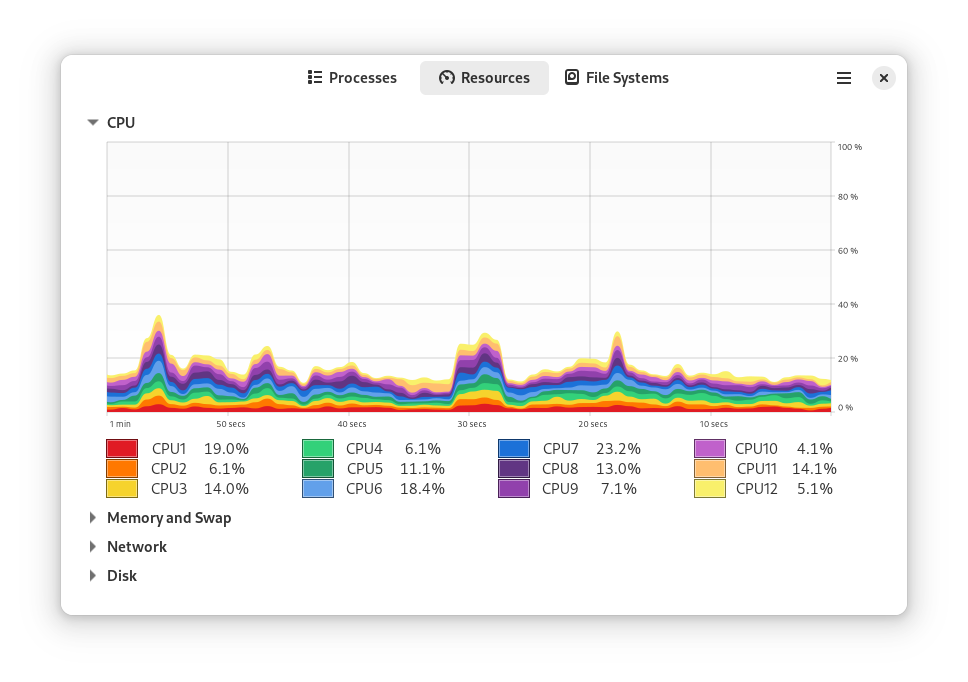
This has long been the default on GNOME-based distributions such as Ubuntu and Fedora Workstation. Search for “System Monitor” in your app menu to see whether you have it. It has three tabs: Processes, Resources, and File Systems. You can sort and search processes, end or kill them, and change their priority.
Pros
- Familiar layout that needs no learning.
- Process control with a right-click.
- Already installed on many desktops.
Cons
- Short history window on the graphs.
- No GPU stats and limited sensor information.
- Few options for customization.
Best for: people who want to end a frozen app and get on with their day.
KDE Plasma System Monitor
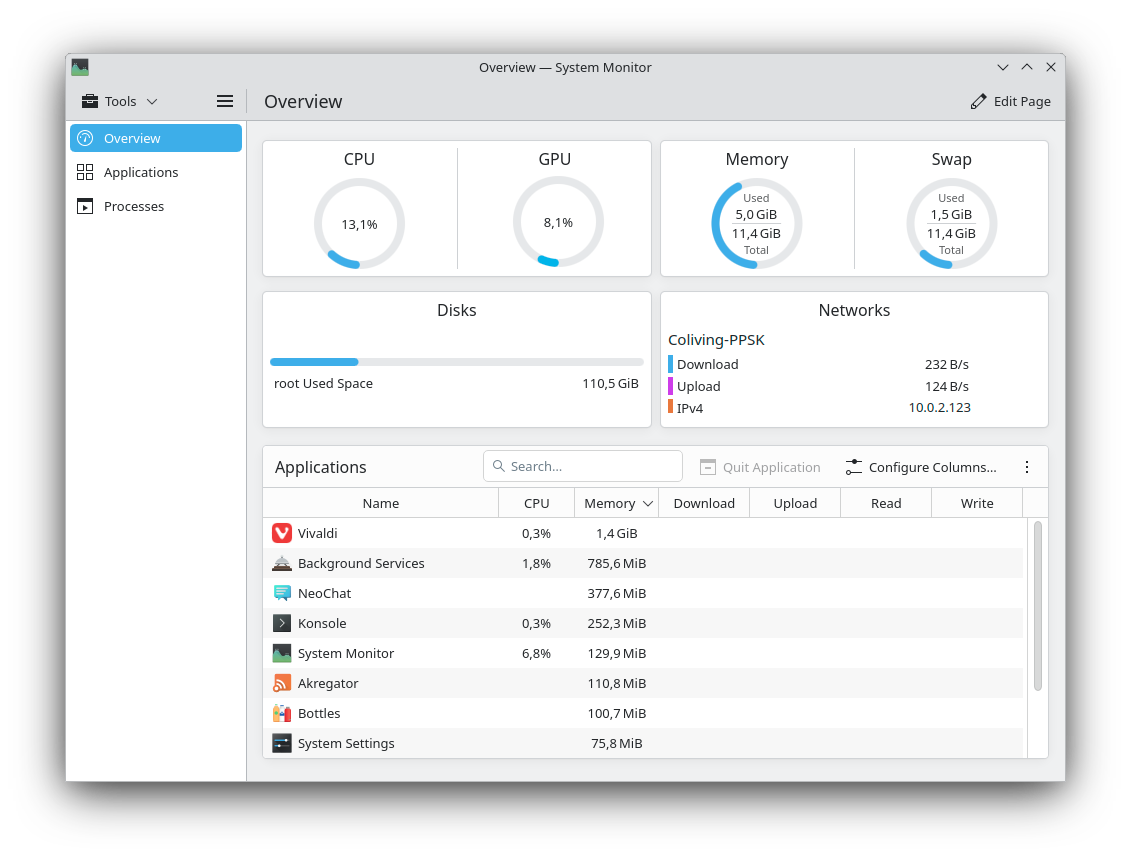
Plasma System Monitor replaced KSysGuard in Plasma 5.21. It opens with Overview, Applications, Processes, and History pages, and you can build your own pages from sensor widgets. The same sensors can go on your desktop or panel as widgets.
Pros
- Custom pages and widgets.
- Application-level view, not just raw processes.
- Hardware sensors and a History page for trends.
Cons
- More to configure than a basic viewer.
- GPU and temperature data depend on your hardware and drivers.
Best for: KDE users who want a desktop monitor they can shape themselves.
Xfce Task Manager and MATE System Monitor
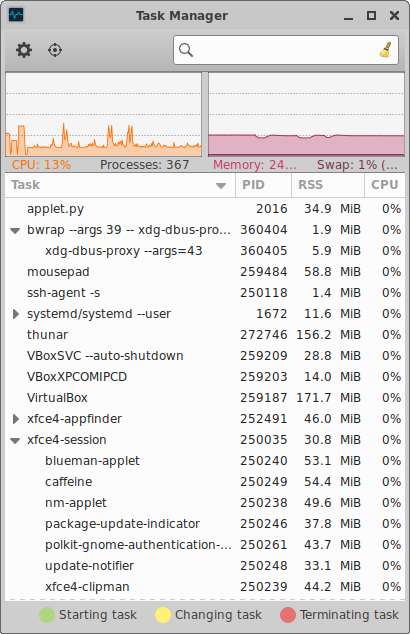
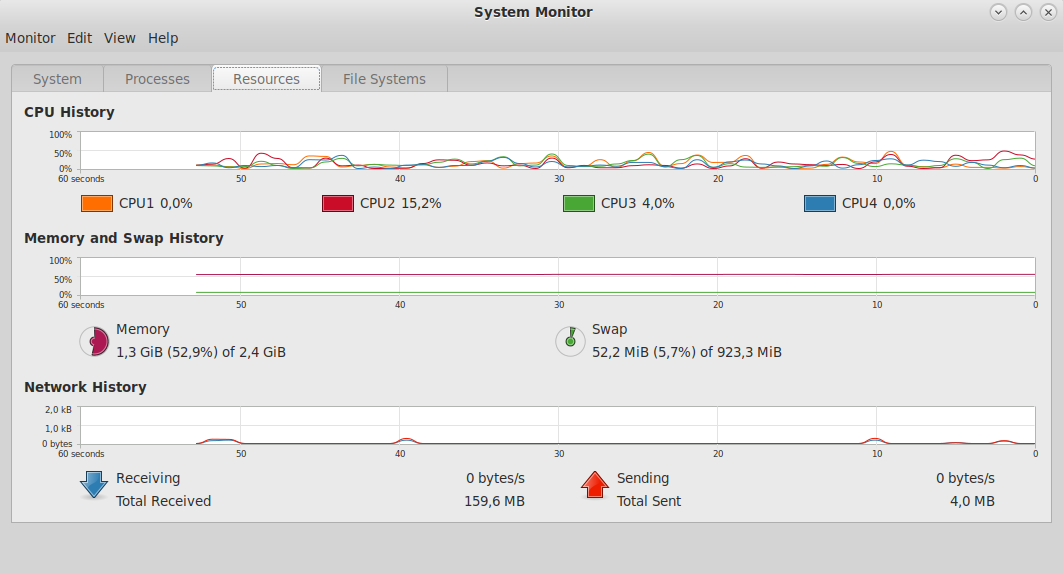
Xfce ships a light Task Manager, and MATE ships MATE System Monitor, which follows the older GNOME design. Both list processes, show basic CPU and memory graphs, and let you end tasks. They do the job on low-powered machines, and that is about all they do.
Handy Terminal Commands
These come with almost every distribution and answer most quick questions:
free -hshows memory and swap in readable units.uptimeshows how long the system has been running and the load averages.vmstat 1prints one line per second covering processes, memory, swap, I/O, and CPU.df -hshows disk space for each filesystem.ps aux --sort=-%mem | head -n 10lists the ten biggest memory users.
The Best System Monitors to Install
The built-in tools cover the basics. The ones below add graphs, history, web dashboards, better process control, or a nicer interface. Most are in your distribution’s repositories, so installation takes one command.
1. btop: Best Overall Terminal Monitor
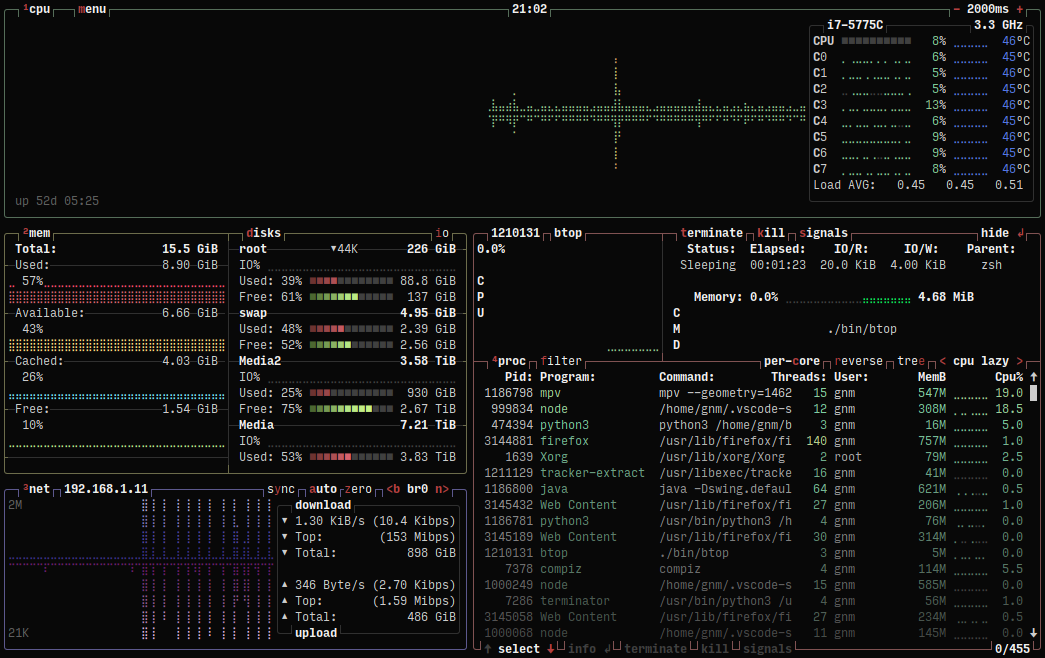
btop (also written btop++) puts CPU, memory, disks, network, and processes on one screen with live graphs. It is written in C++ and continues the bashtop and bpytop line from the same developer. It supports mouse clicks, ships with themes, and lets you filter processes, switch to a tree view, and send signals without leaving the app. Recent versions can also show GPU data, depending on your hardware and how the package was built.
Pros
- Everything on one screen, with history graphs.
- Mouse support and an in-app menu make it easy to learn.
- Themes and adjustable layout.
- Process filtering, tree view, and signal sending built in.
Cons
- Looks cramped in a small terminal window.
- Uses more CPU than top or htop, though it is still light on modern hardware.
- Repository versions can lag behind, and features such as GPU support depend on the version.
Install
sudo apt install btop      # Debian, Ubuntu, Mint
sudo dnf install btop      # Fedora
sudo pacman -S btop        # Arch
Best for: anyone who wants one terminal tool that covers everything.
2. htop: Best Lightweight Classic
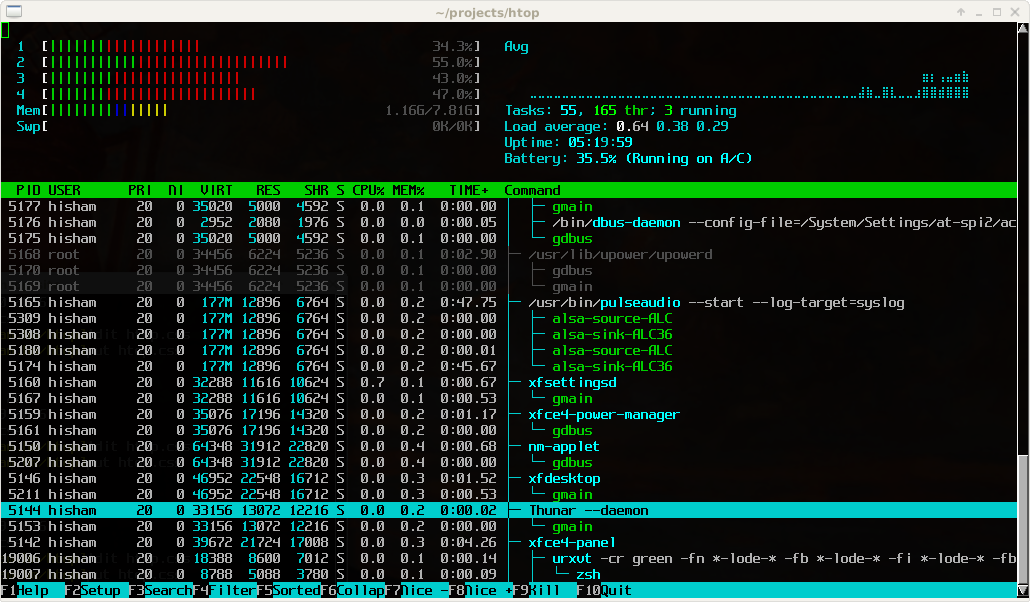
htop is the upgrade most people made from top years ago. It shows colored bars for every CPU core, memory, and swap, and lists processes you can scroll in both directions. A footer lists the main commands: F3 to search, F4 to filter, F5 for tree view, F6 to sort, and F9 to kill. Select a process and press s to attach strace or l to list its open files with lsof, provided those tools are installed.
Pros
- Fast, light, and stable.
- Footer hints make it easy to learn.
- Mouse support and configurable columns and meters through F2.
- Packaged in nearly every distribution.
Cons
- Limited disk and network insight compared with btop or Glances.
- No history graphs.
- Text-only interface.
Install
sudo apt install htop
sudo dnf install htop
sudo pacman -S htop
Best for: daily process management, especially over SSH.
3. Glances: Best for Remote Access and Data Export
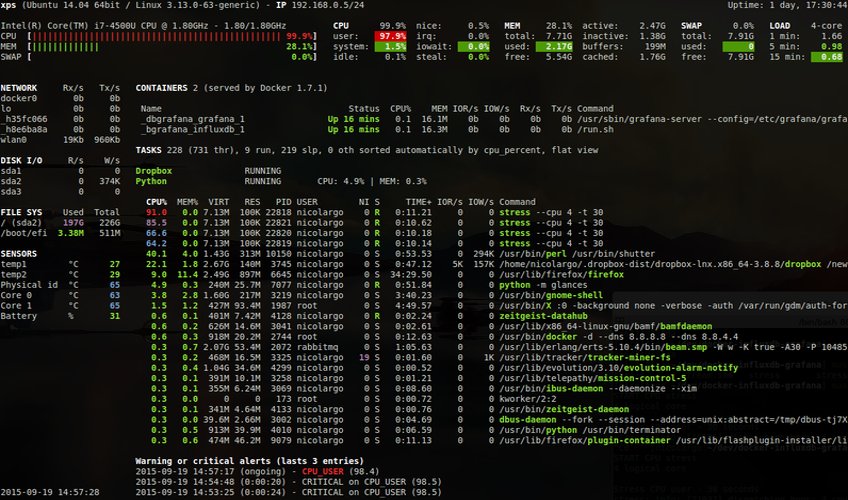
Glances is a Python-based monitor that fits a lot onto one screen: CPU, memory, load, network, disk I/O, sensors, file systems, containers, and a process list. Values change color as they cross warning thresholds. What sets it apart is that it can run as a web server with glances -w, so you can open the dashboard from a browser. It also has a REST API and exports to InfluxDB, Prometheus, CSV, and other targets.
Pros
- Web mode is ideal for headless machines.
- Client and server modes for watching remote systems.
- API and export options for feeding other tools.
- Threshold alerts and container stats.
Cons
- Python makes it heavier than htop.
- Some plugins need extra Python packages.
- The web interface has no password unless you set one.
Install
sudo apt install glances
sudo dnf install glances
pipx install 'glances[all]'
Run glances for the terminal view or glances -w for the web view, which listens on port 61208 by default.
Best for: remote servers and anyone who wants to send metrics into other systems.
4. Netdata: Best for Servers That Need a Real Dashboard
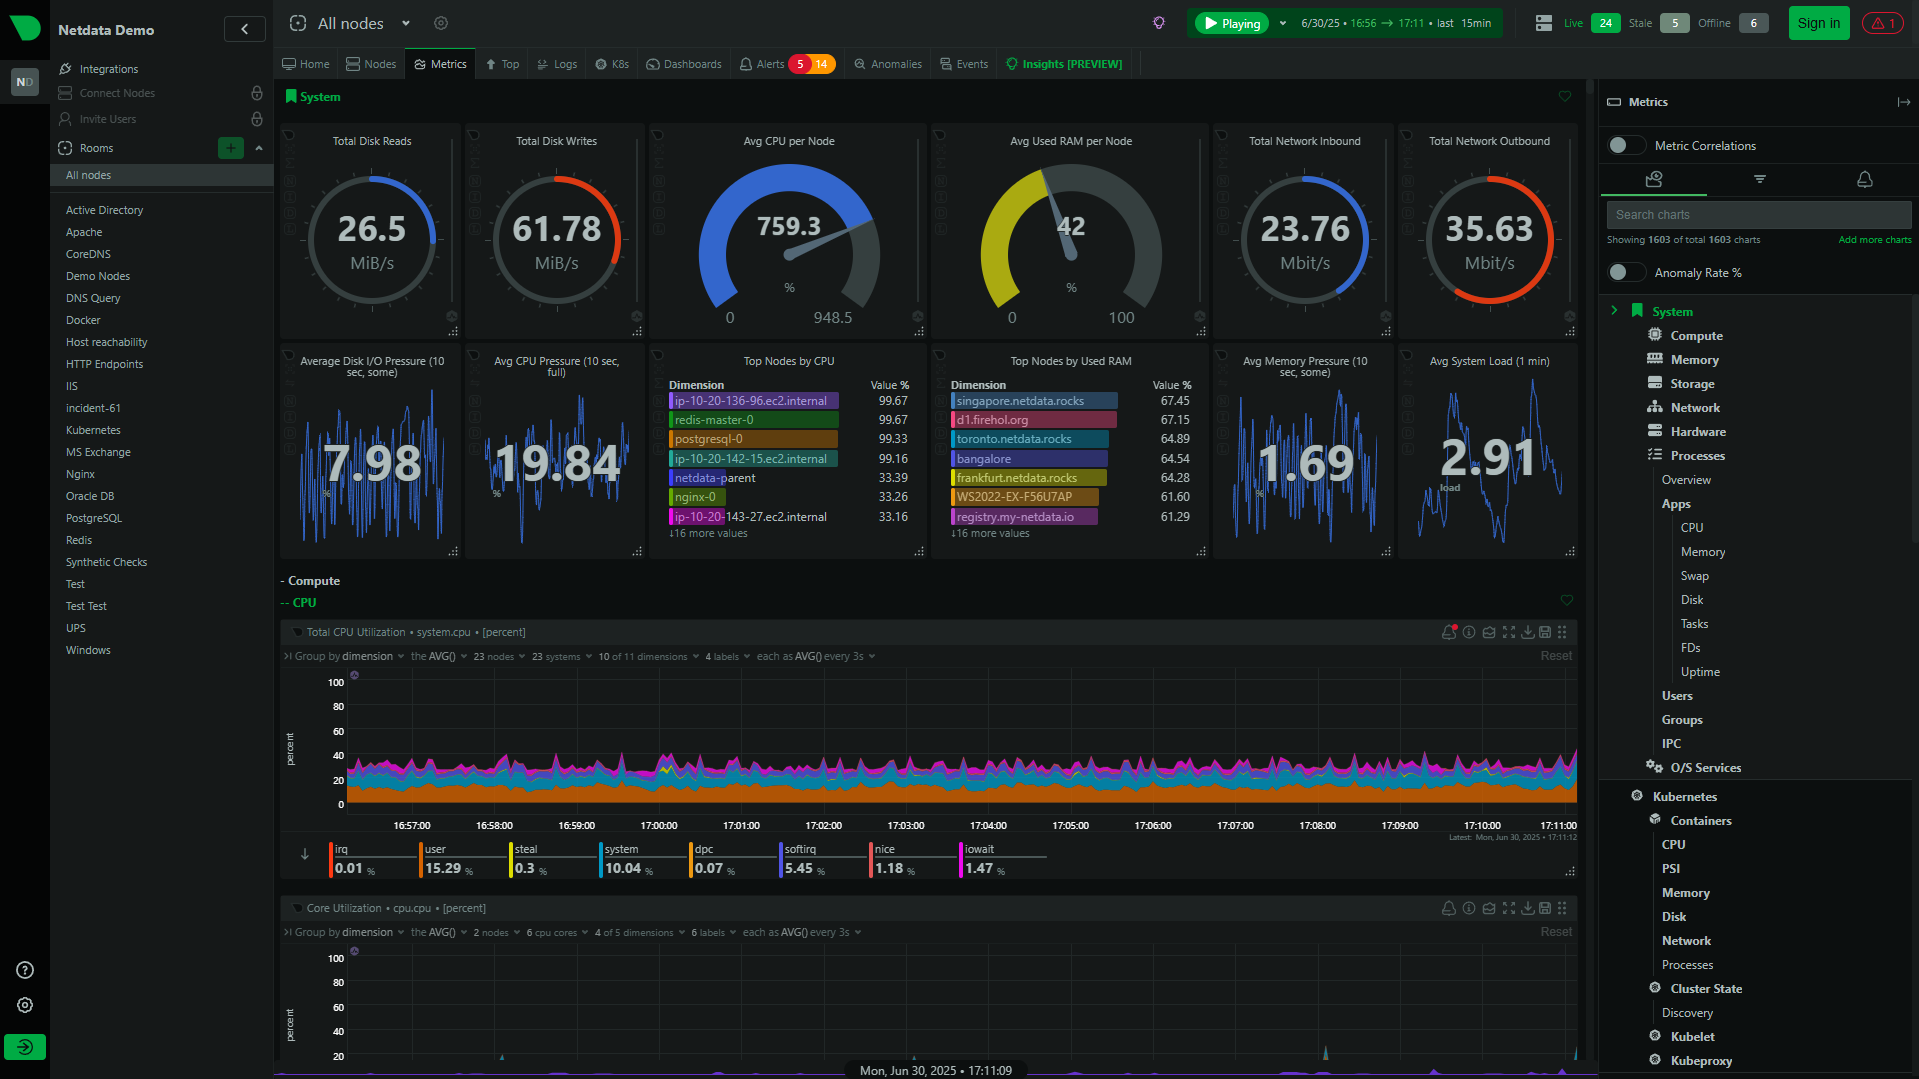
Netdata collects metrics every second and shows them on a browser dashboard, served on port 19999 by default. It detects supported services such as web servers, databases, containers, and disks on its own and starts charting them without configuration. It includes ready-made alerts and machine learning based anomaly detection. Data from several machines can be viewed together through Netdata Cloud.
Pros
- Per-second resolution, so short spikes do not get averaged away.
- Auto-discovery of many services with no setup.
- Built-in alerts and anomaly detection.
- The open-source agent is free.
Cons
- More than most laptops need.
- Runs a background service and opens a network port.
- Sends anonymous usage statistics unless you opt out.
- Some multi-node features live in Netdata Cloud, which has paid tiers.
Install
wget -O /tmp/netdata-kickstart.sh https://get.netdata.cloud/kickstart.sh
sh /tmp/netdata-kickstart.sh --disable-telemetry
Read any install script before you run it. Many distributions also package netdata in their own repositories.
Best for: servers, home labs, and anyone who wants graphs and alerts without building a monitoring stack.
5. Mission Center: Best Desktop App for Windows Task Manager Fans
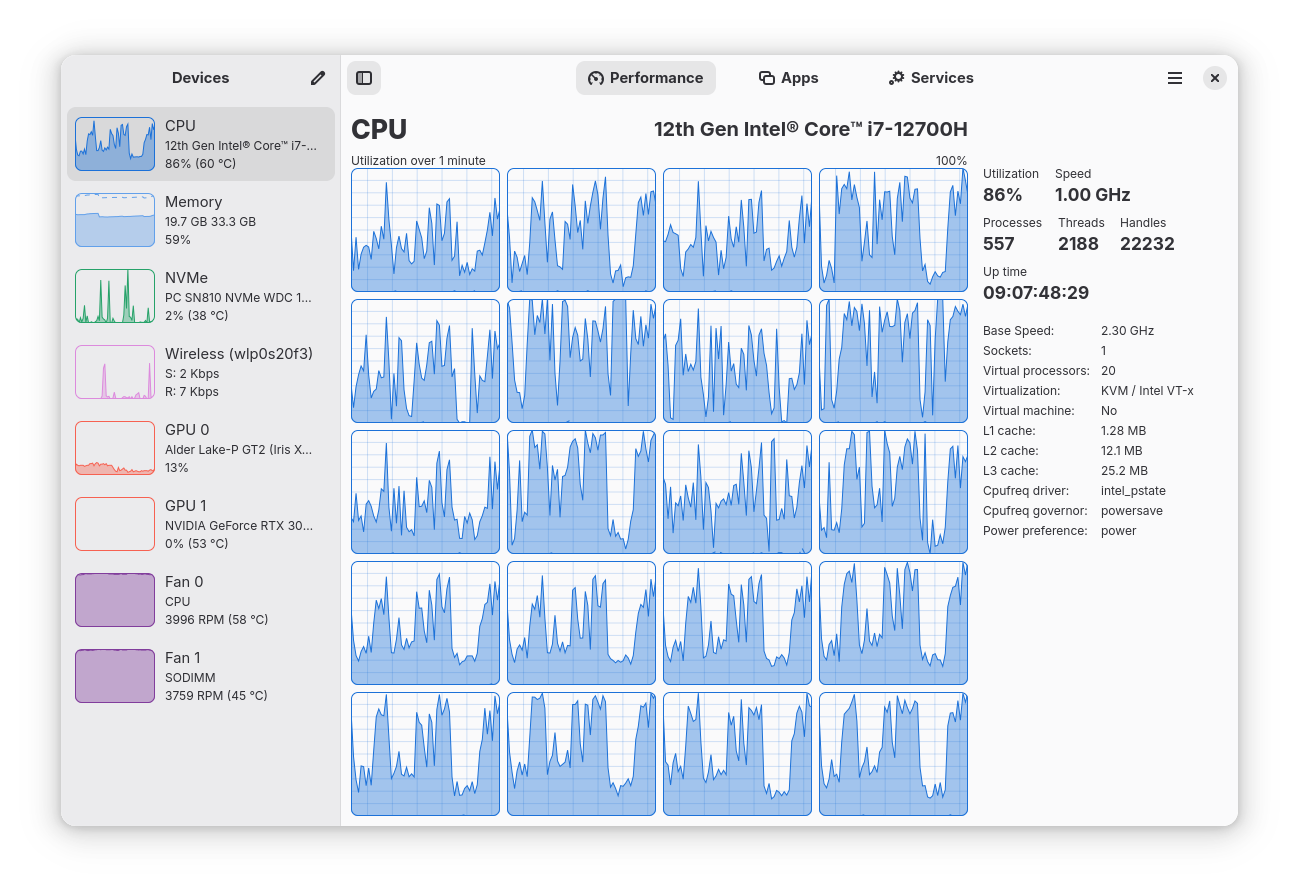
Mission Center is a GTK4 application written in Rust that looks a lot like the Windows Task Manager. A sidebar lists CPU, memory, disks, network, and GPUs from NVIDIA, AMD, and Intel, each with live graphs and detailed stats. The Apps page groups processes by application, which reads far better than a flat list of forty browser subprocesses.
Pros
- Clean interface with a familiar layout.
- GPU stats across the main vendors.
- Processes grouped by app.
Cons
- The GNOME-style design looks out of place on some KDE setups.
- Distributed mainly as a Flatpak.
- No remote or headless use, and limited customization.
Install
flatpak install flathub io.missioncenter.MissionCenterBest for: desktop users who want a modern, Task Manager style overview.
6. Resources: Best Simple GUI Replacement for GNOME System Monitor
Resources is a GTK4 and libadwaita app written in Rust. It is similar in spirit to Mission Center but plainer. It lists apps and processes with their CPU, memory, and GPU use, and it shows drives, network interfaces, and battery status on laptops.
Pros
- Clean, uncluttered interface.
- Apps and processes in one place.
- Battery and drive information included.
Cons
- Fewer options than Plasma System Monitor or Conky.
- Flatpak-first distribution.
- Desktop only.
Install
flatpak install flathub net.nokyan.ResourcesBest for: GNOME users who want something newer than the default without a learning curve.
7. bottom: Best Customizable Terminal Monitor
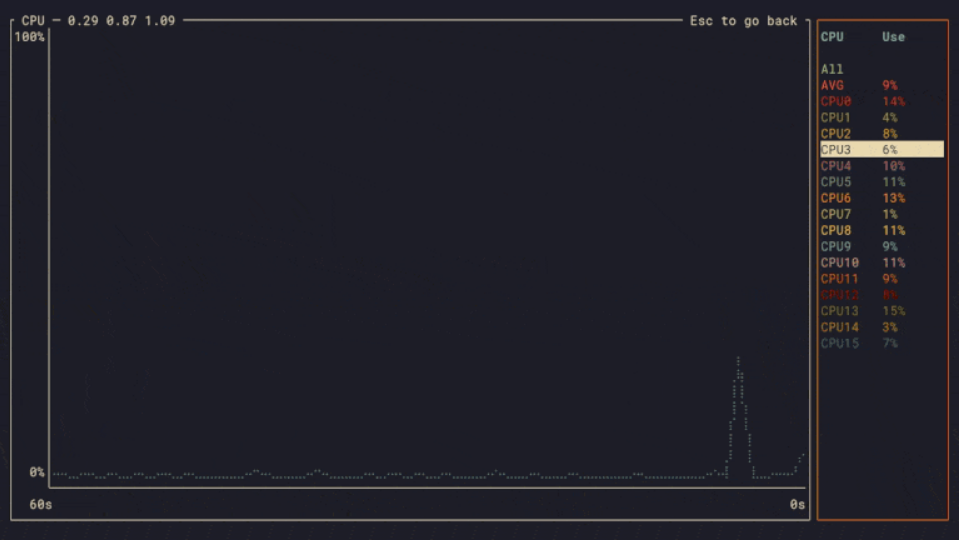
bottom, launched with the command btm, is a cross-platform terminal monitor written in Rust. It draws graphs for CPU, memory, network, disks, temperatures, and processes. You can rearrange the widgets in a config file, expand any widget to full screen, and switch the process list to a tree.
Pros
- Layout is fully configurable.
- Fast, and ships as a single binary.
- Works on Linux, macOS, and Windows.
Cons
- Smaller community than htop or btop.
- Customizing means editing a TOML file.
- Not in every default repository.
Install
sudo pacman -S bottom          # Arch
cargo install bottom --locked  # any distro with Rust installed
Prebuilt packages are also available from the project’s GitHub releases page.
Best for: people who want a terminal monitor laid out exactly their way.
8. atop: Best for Finding Out What Happened Last Night
atop solves a problem the others ignore. Most monitors only show the present. atop records system and process activity to log files at regular intervals, so you can replay any moment later. If a server froze at 3 a.m., open that day’s log and step through the samples. It also highlights the resource that is overloaded, and it keeps records of processes that already exited.
To replay yesterday from 3 a.m., run atop -r /var/log/atop/atop_20260929 -b 03:00, then press t to move forward and T to move back.
Pros
- Historical replay for post-mortems.
- Catches short-lived processes other tools miss.
- Marks the bottleneck resource so you know where to look.
Cons
- Dated interface with a steep learning curve.
- Logging writes to disk, though the interval is adjustable.
- Per-process network stats need an extra add-on.
Install
sudo apt install atop
sudo systemctl enable --now atop
Best for: servers where you need to explain an outage after the fact.
9. nmon: Best for Performance Tuning
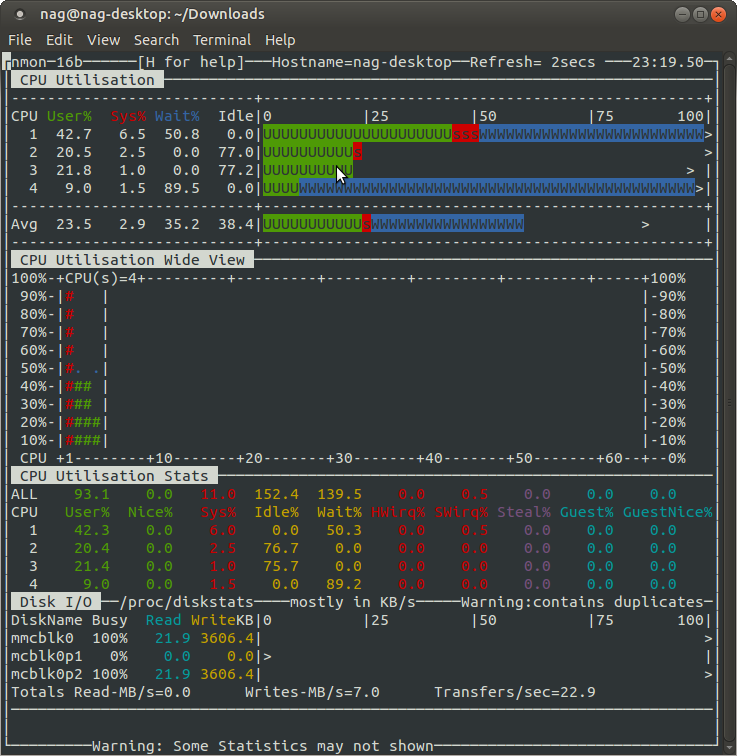
nmon, short for Nigel’s Monitor, started at IBM for AIX and now runs on Linux. Single keystrokes toggle sections: c for CPU, m for memory, d for disks, n for network, and t for top processes. Its recording mode, nmon -f, writes data to a file for later analysis, which helps when you compare benchmark runs.
Pros
- Compact view that you shape with a few keys.
- Record mode suits benchmarks and tuning work.
- Very light on resources.
Cons
- Old-school interface with no mouse support.
- Less friendly for day-to-day process management.
Install
sudo apt install nmon
sudo dnf install nmon
Best for: sysadmins measuring the effect of tuning changes.
10. Conky: Best for Desktop Widgets
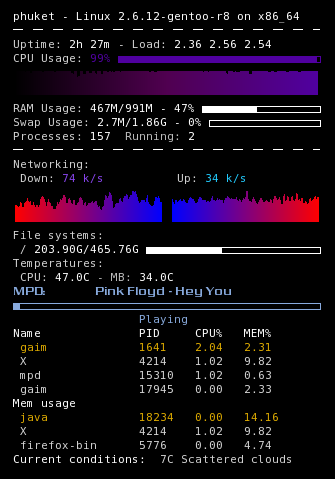
Conky is not a window you open. It draws system stats directly on your desktop background: CPU, RAM, network speed, disk usage, and anything else you can script. You configure it in a text file with Lua support, and there is a large library of community themes to start from.
Pros
- Always visible without taking up a window.
- Extremely customizable.
- Very low resource use.
Cons
- Setup takes time.
- No process control.
- Older configs found online may use outdated syntax.
- Works best on X11, and Wayland support depends on your Conky version and compositor.
Install
sudo apt install conky-all
sudo dnf install conky
sudo pacman -S conky
Best for: people who like a live stats display on their desktop and enjoy tweaking.
Specialist Tools Worth Knowing
General monitors cover a lot, but these single-purpose tools go deeper on one subject:
- nvtop: an htop-style GPU monitor for NVIDIA, AMD, and Intel cards.
- iotop: shows which process is reading or writing to disk. It needs root. The iotop-c rewrite is actively maintained.
- nethogs: shows bandwidth use per process.
- iftop: shows bandwidth use per network connection.
- s-tui: shows CPU frequency, temperature, and power, with a built-in stress test.
- powertop: shows what drains your laptop battery.
- lm-sensors: the
sensorscommand prints temperatures, fan speeds, and voltages. Runsudo sensors-detectonce to set it up. - Stacer: a GUI tool that combines monitoring with startup app, service, and cleanup management. Development has slowed, so check the project’s recent activity before you depend on it.
How to Read What Your System Monitor Shows You
Installing a monitor is the easy part. These are the numbers people misread most often:
- Load average: the three numbers are averages over 1, 5, and 15 minutes. On Linux they count processes that are running or waiting for CPU, plus processes stuck waiting on disk. A sustained load above your core count means work is queueing up. If the load is high but CPU usage is low, look at disk I/O.
- Available memory: Linux fills spare RAM with disk cache and hands it back the moment a program asks. A tiny “free” number is normal. Look at “available” in the output of
free -hinstead. - Swap: some swap use is harmless. Constant swapping in and out, visible in the
siandsocolumns ofvmstat 1, means you are short on RAM. - iowait (wa): the share of time the CPU sat idle waiting for storage. High values point to a slow or overloaded disk, not a CPU problem.
- Steal time (st): on virtual machines, time the hypervisor gave your CPU to another guest. High steal on a cloud server means noisy neighbors or an undersized plan.
How to Choose the Right System Monitor
- Quick check on any machine: use top or htop.
- One good terminal tool: install btop.
- A desktop app: use Mission Center or Resources, or stay with the one your desktop includes.
- A headless server you can open in a browser: use Glances or Netdata.
- Answers about a past incident: run atop with logging on.
- Stats on your wallpaper: set up Conky.
- Many servers: look at Netdata Cloud, Prometheus with Grafana, or Zabbix. A single-machine monitor stops being practical past a handful of hosts.
Keep Web Dashboards Off the Public Internet
Glances in web mode and Netdata both listen on network ports. Do not leave them open to the internet. Set the bind address in the Glances options (glances -w -B 127.0.0.1) or in the [web] section of netdata.conf, then reach the dashboard through an SSH tunnel:
ssh -L 19999:localhost:19999 user@your-serverNow open http://localhost:19999 in your browser. If you need direct access, put the dashboard behind a VPN, a firewall rule, or a reverse proxy with authentication.
Which System Monitor Should You Install?
Install htop and btop on every machine. They cost almost nothing, and between them they cover the vast majority of “why is this slow” questions. On a desktop, add Mission Center or Resources if the built-in monitor feels too basic. On a server that matters, add Glances for quick remote checks or Netdata for dashboards and alerts, and turn on atop so an outage leaves evidence.
Frequently Asked Questions
What is the best system monitor for Linux?
There is no single winner because it depends on where you work. For the terminal, btop is the best all-rounder and htop is the best lightweight classic. For a desktop app, Mission Center and Resources are the strongest modern options. For servers, Glances and Netdata add web dashboards and alerts.
What is the default system monitor in Linux?
It depends on your desktop environment. GNOME uses GNOME System Monitor, KDE Plasma uses Plasma System Monitor, Xfce uses Xfce Task Manager, and MATE uses MATE System Monitor. In the terminal, the top command is available on practically every distribution.
Is btop better than htop?
btop shows more on one screen, including network, disk, and graph history, and it has mouse support and themes. htop is lighter, simpler, and packaged nearly everywhere. Many people keep both: htop for quick checks and btop for a fuller picture.
How do I check CPU and memory usage in the Linux terminal?
Run top or htop for a live view of CPU, memory, and processes. For a quick snapshot, use free -h for memory and swap, uptime for load averages, and vmstat 1 for a running per-second summary.
Do system monitors slow down my computer?
Only slightly. top and htop use almost nothing. Tools such as Glances and Netdata use more because they collect more data and run background services. A faster refresh rate increases overhead, so a one or two second interval is plenty for most work.
Can I monitor a remote Linux server?
Yes. The simplest method is to connect over SSH and run htop or btop. For a browser view, run Glances in web mode or install Netdata. For many servers at once, look at Netdata Cloud, Prometheus with Grafana, or Zabbix. Keep web dashboards behind a firewall, VPN, or SSH tunnel.
How do I monitor GPU usage on Linux?
nvtop shows usage for NVIDIA, AMD, and Intel GPUs in the terminal. Mission Center and Resources show GPU stats in a desktop window, and recent versions of btop can display GPU data as well. Vendor tools such as nvidia-smi and radeontop give more detail for a single brand.
Why does Linux show almost no free memory?
Linux uses spare RAM as disk cache to speed up file access and releases it as soon as programs need it. Ignore the free column and look at available memory in the output of free -h. Trouble starts when available memory is low and swap is busy.
Is there a Linux equivalent of Windows Task Manager?
Yes. GNOME System Monitor and Plasma System Monitor come with their desktops. Mission Center is the closest match to the Windows Task Manager layout, and Resources offers a simpler take.
